View Session
After an Interactive Session is submitted, you will be taken to the Interactive Session page. On this page you can see the Interactive Sessions you have created with the status of each.
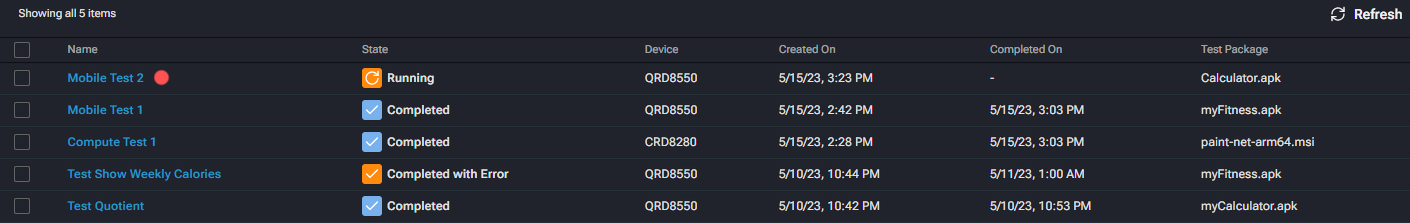
- The list of Jobs includes Job Name, State, Device, Start/Stop timestamps, and Test Package
- The State can be Submitted, Setup, Running, Completed, Canceled, or Completed with Error (this indicates that QDC encountered an error and was unable to configure the device)
Upon session submission, the session will appear in the list as Setup, indicating that it is being configured. When the device is configured and ready to be used, the status will change to Running and a pulsing red circle will appear indicating that the session is active. Purchased minutes do not start being deducted while the device is being configured, but as soon as the session starts running the session minutes will start being used. At this point, you can click on the name of the session to open it. See Section 5.3 for details on interacting with a device in real-time.
For non-active sessions, click the Session Name to open the Session Results window.
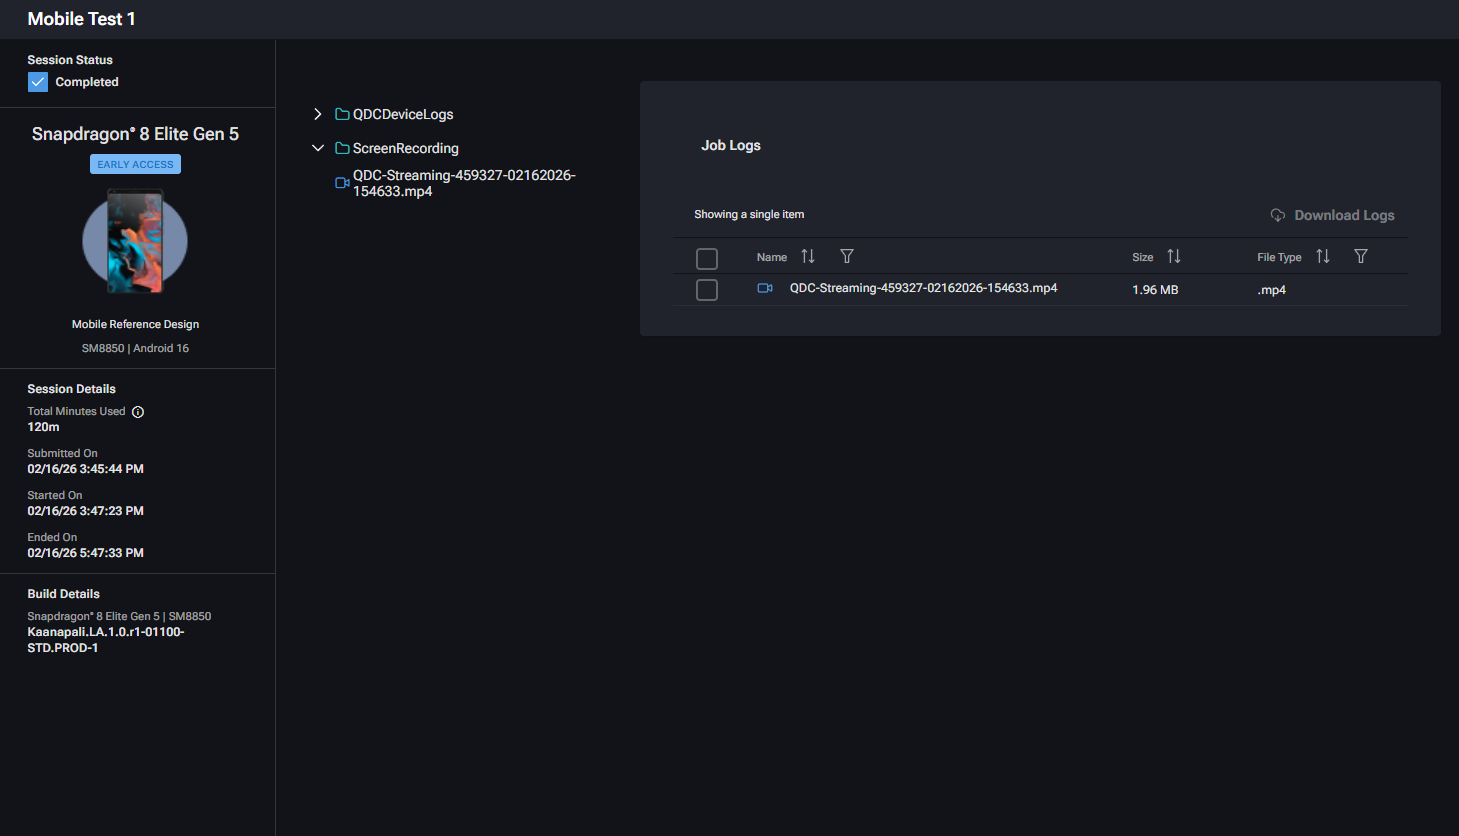
In the Session Results window:
- The left panel contains details about the session, including:
- Session Status – Shows if the session completed successfully or if QDC encountered an error or user cancellation
- Device details
- Session details such as session duration, start/stop timestamps, application used, and test type
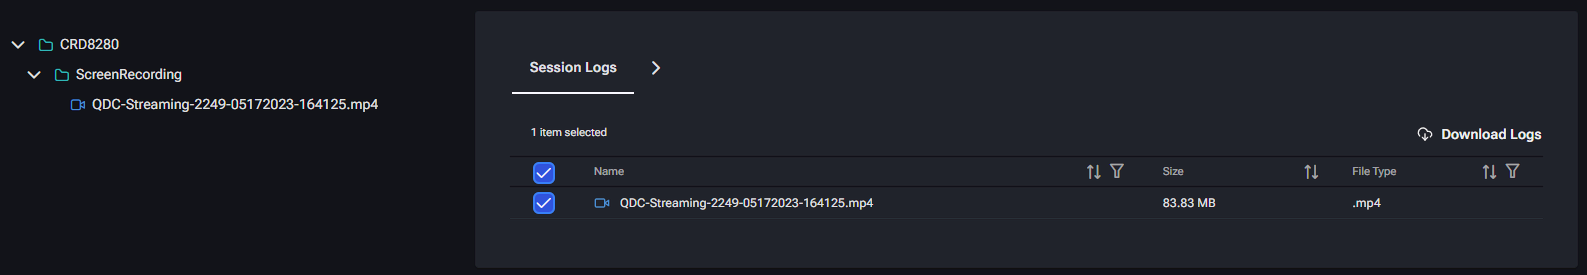
- The main panel provides the screen recording and logs for the session.
- Click Download File to download the Whole Host Log
- Click to view the test notes. If an error occurred, this window shows the reason QDC was unable to run the session.
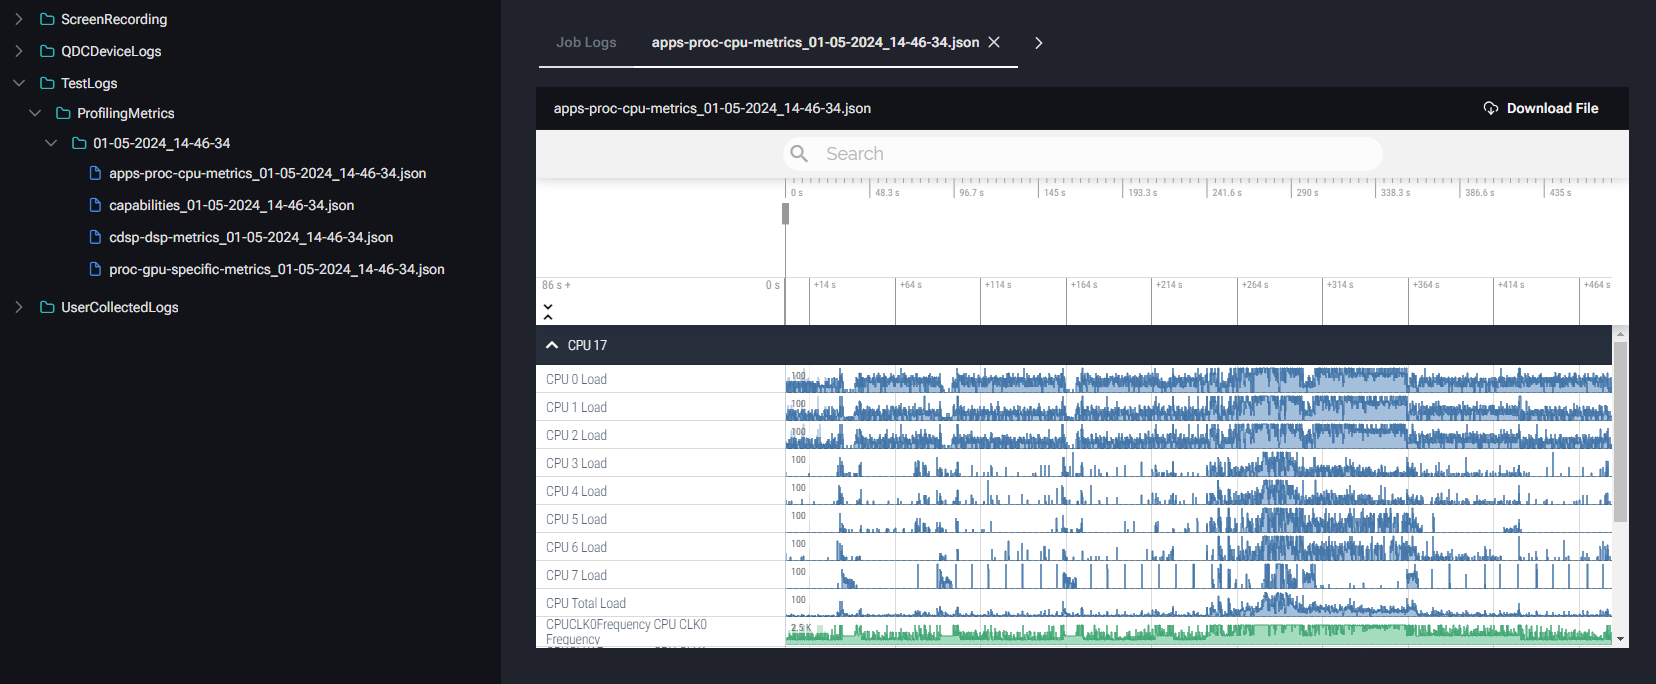
Profiling Data
If Profiling Enabled was toggled on during job setup, profiling metrics can be found under TestLogs -> ProfilingMetrics.