View Jobs
After a job is submitted, you will be taken to the Automated Jobs page. Here, you can see the Automated Jobs you have created along with the status of each job.
- The list of jobs includes Job Name, Result, Device, Completion Timestamp, Test Framework used, and Test Package used
- Based on the test status, the Result can be Pending, Successful, Unsuccessful, Canceled, or Error
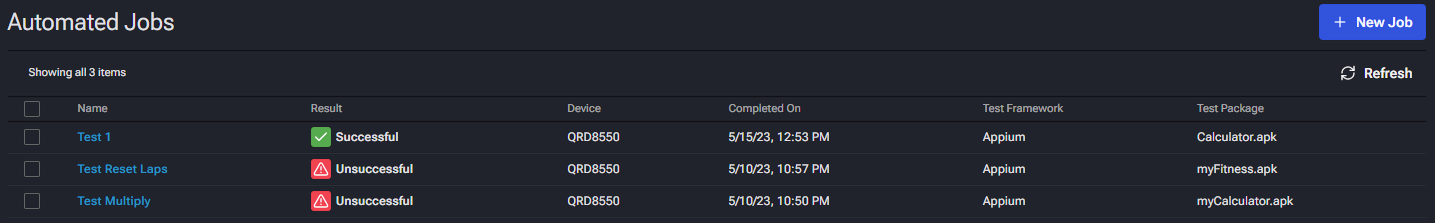
Upon job submission, the job will appear in the list as Pending. As soon as the device is configured and tests are complete, the status will change to Successful or Unsuccessful. Successful Jobs indicate that every test case included in the Appium script succeeded. Unsuccessful Jobs indicate that at least one test case failed in the Appium script.
Click the Job Name to open the Job Results window.
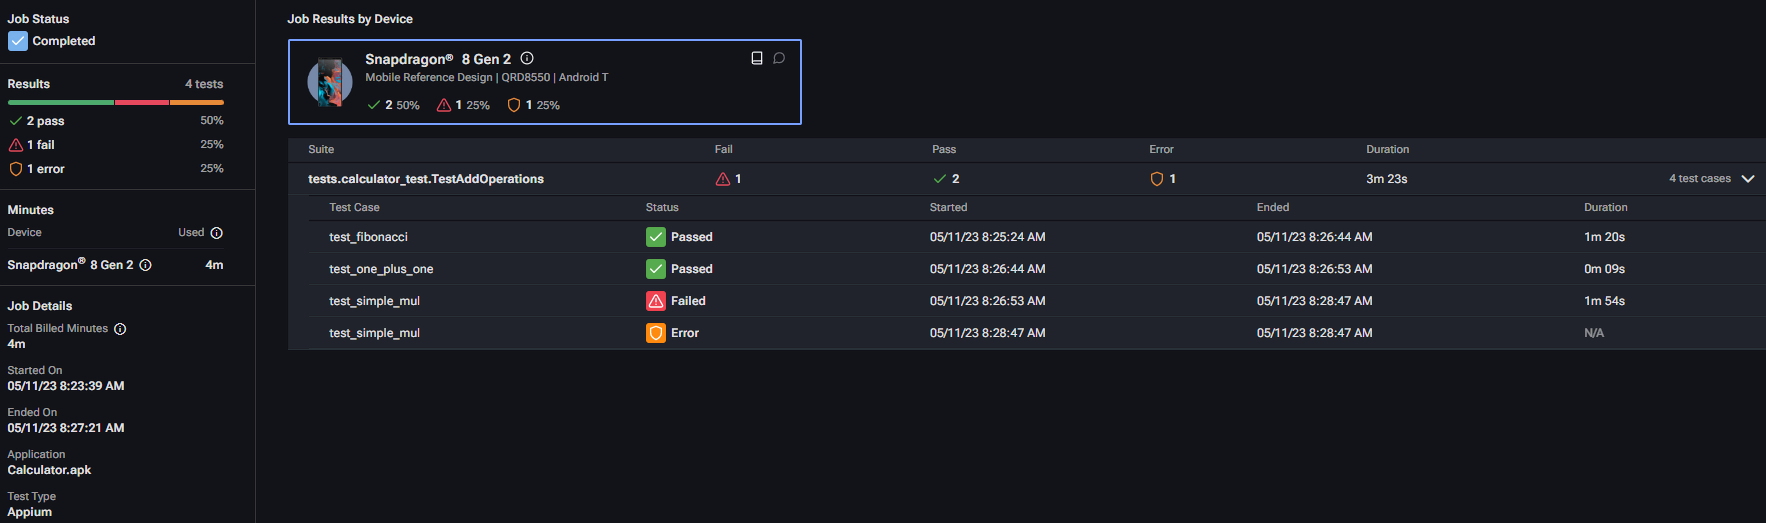
In the Job Results window:
- The left panel contains details about the job, including:
- Job Status – Shows if the job completed successfully or if QDC was unable to complete the job due to an error or user cancellation
- Test Results – Shows how many test cases passed, failed, or encountered an error
- Minutes used on each device
- Job details such as session duration, start/stop timestamps, application used, and test type
- The main panel shows all the test suites that were run. Each test suite can be expanded to show the results for individual test cases.
- Click
 to view the test notes. If an error occurred, this window shows the reason QDC was unable to complete the job.
 - Click
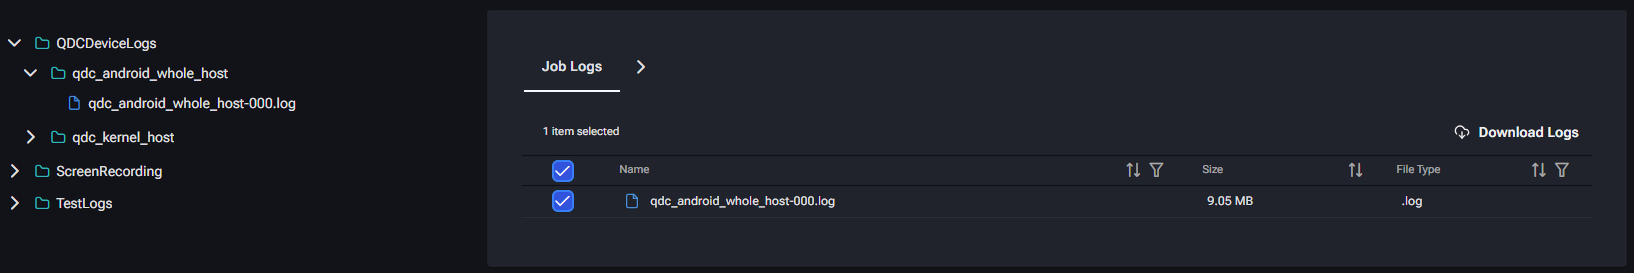
 to open the Log window. This window contains all logs and screen recordings from the job and provides the option download them for use outside QDC.
- Click
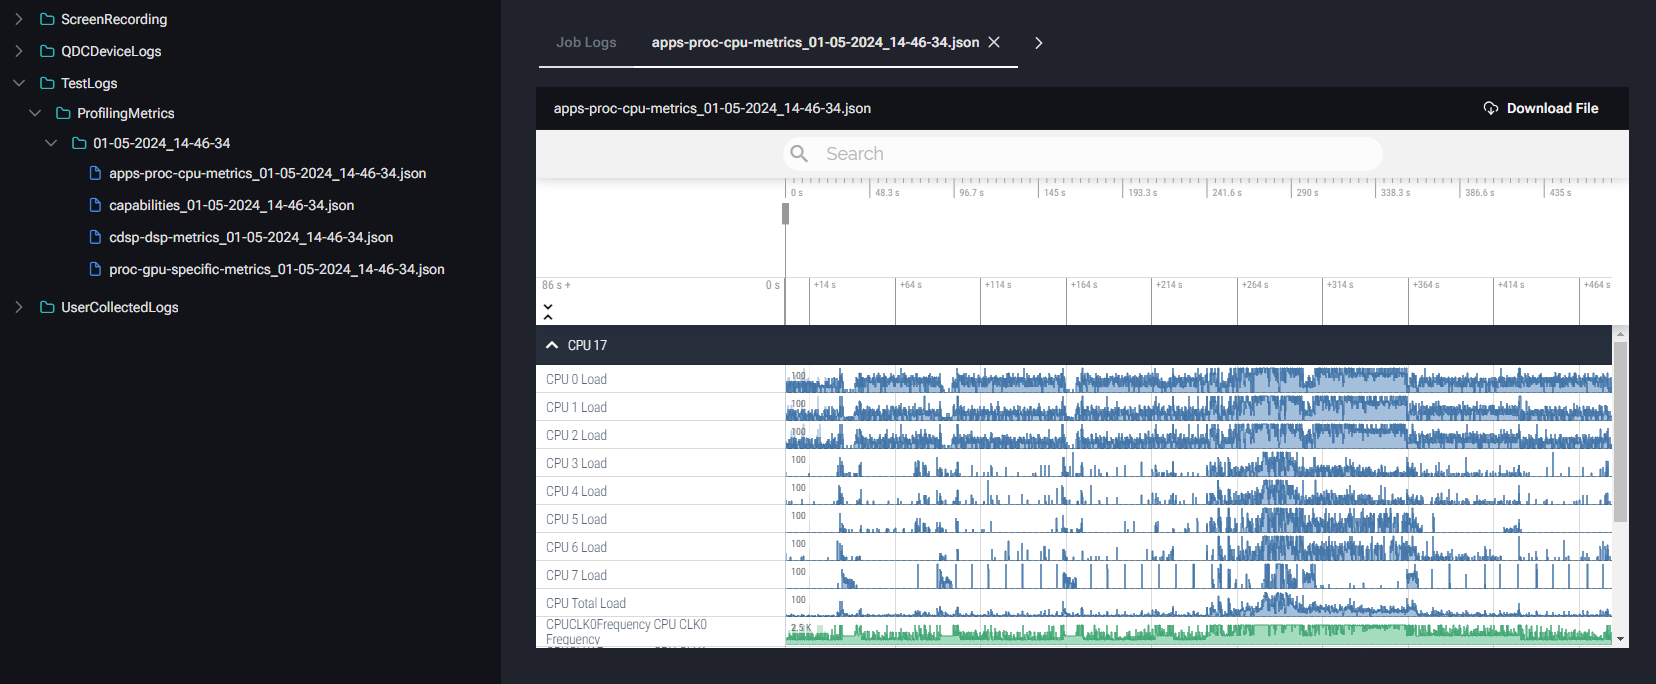
Profiling Data
If Profiling Enabled was toggled on during job setup, profiling metrics can be found under TestLogs -> ProfilingMetrics.